Latest posts by Ed Park (see all)
- Bring on the Lucie by Hallelujah the Hills - October 9, 2015
- Experiment: Two Words - July 27, 2013
- POV - July 19, 2013

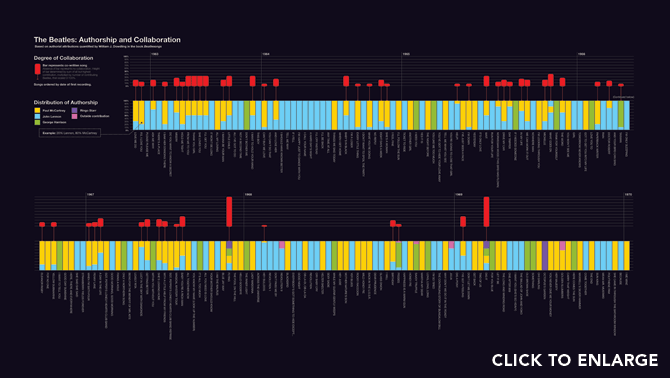
A Beatles Authorship and Collaboration Chart by Mike Deal
I don’t think I understand this yet, but it’s beautiful.
Color patterns offer clues about the band’s gradual fracturing as each member becomes more independent. Red stalks (signifying jointly written songs) decrease in the second half of the timeline; the split-color bars give way to solid bars of a single color. George Harrison also began to compose more music as he matured as a songwriter, signified by the increase in green bars (Lennon and McCartney’s lack of support through Harrison’s development is widely cited as a factor contributing to the band’s eventual breakup).
(Via.)


The description you cited actually refers to a different image, the “authorship and collaboration” timeline on the same page of Beatles graphs.